 扫一扫,手机浏览
- 技术文章
Application of Power Monitoring System in Adama I
2021-05-21 10:35:45 来源:安科瑞王蒙蒙
Abstract: Introduce the project of Adama industrial park, Ethiopia, which uses intelligent power meters to collect various electrical parameters and switch signals at the distribution site. The system adopts the method of on-site networking. After networking, it communicates via fieldbus and transmits it to the background. The Acrel-2000 power monitoring system realizes real-time monitoring and management of power distribution circuit power in the distribution room.
Keywords: intelligent power meter; Acrel-2000; power monitoring system
0 Demand analysis
To ensure the statistics and analysis of electricity load for production management and real-time monitoring of hazard sources. Real-time online monitoring of parameters such as voltage, current, and power in the incoming and outgoing circuits of the power distribution room at the project site is required. Once the monitoring point is monitored with abnormal parameters, it can detect and alarm in time, and relevant personnel can take necessary measures to avoid safety accidents. The automatic meter reading function saves manpower and material resources. The power trend curve function can intuitively display the working status and time of each circuit, which is convenient for users to find abnormal power circuits and make corrections in time, and establish a multi-level electrical energy measurement system to provide energy analysis basis .
Data collection
Automatically collect analog data of all power meters on site, and automatically collect on-site switching data such as on-site switch status and fault status.
Support real-time collection, automatic periodic collection (timing collection) configurable cycle (1 minute to 24 hours).
Support data transmission correctness inspection, automatic processing of abnormal data.
Support multi-threaded processing mechanism, improve the efficiency of data collection, and can collect data from multiple devices at the same time.
The real-time data display adopts the intuitive display mode of the main wiring diagram of the distribution box, and the disconnection and fault status of each circuit switch are intuitively visible.
Data analysis and processing
Comprehensive statistics and analysis of data need to achieve the following functions:
Statistics and calculation of the electricity consumption data of each equipment in hours, days, months, years and other time periods.
Calculate the large, small and average value of the electrical load (active power, reactive power) of each device.
Count the power consumption (active power and reactive power) of each substation and the whole.
Data query and display
It is required to facilitate the realization of client query and query of managers at all levels. The query interface can adapt to the requirements of managers at all levels. It can support flexible condition combination query and comparative analysis. Various types of statistical analysis data can be flexibly used in reports and other charts. Intuitive display function.
According to the different permissions of different users, the data display function is divided into three layers: operation layer, management layer, and decision-making layer.
The operation layer has functions such as energy consumption analysis, cumulative consumption, real-time monitoring, running records and ratios, comparison, and benchmarking analysis.
The management has functions such as statistics and analysis of energy consumption data, comparison of classification and sub-items, and benchmarking analysis.
The decision-making layer has functions such as energy data analysis, data deletion, and database import/export.
authority management
It is required to assign different roles to different users, and be able to authorize function sub-menus, specific file records, data records, etc.
The system requires a reasonable and complete user security control mechanism to protect the information resources in the application environment and prevent the loss, theft and destruction of information.
Energy-saving renovation and effect evaluation
It is required to provide data support for the energy-saving transformation of production, and can provide the effect evaluation before and after the energy-saving transformation.
parameter settings
The transformer ratio of each loop and the setting value of various current and voltage protection can be set through the acquisition cabinet.
Fault judgment and alarm have automatic fault judgment and use sound and light alarm function. Alarm types include switch failures, voltage and current overruns, communication failures of the field acquisition module, and communication failures with the monitoring system. The alarm time is automatically recorded in the system database, which is convenient for users to inquire. The staff can grasp the real-time operation status of the substation at any time, find the operation failure of the substation and distribution, and make corresponding treatments, improve the management efficiency of the substation and distribution, and enhance the safety of the power system. reliability.2 System solutions
1) According to the actual situation of Adama industrial park, the overall network structure of Acrel-2000 system adopts shielded twisted pair to directly connect to the data collector and then directly connect to the monitoring host in the power distribution room through the network cable, ensuring the transmission of the power monitoring and monitoring system. The stability and real-time performance.
The station control management layer is the direct window of human-computer interaction for the management personnel of the power monitoring system. In the Adama Project, it mainly refers to the monitoring host placed in the power distribution room on the first underground floor.
2)Network communication layer
The communication layer is mainly composed of collectors, Ethernet devices and bus networks. The main function of the serial server is to monitor on-site intelligent instruments; the main function of Ethernet equipment and bus network is to realize the data interaction between the substation and the main station, so that the management of the power distribution system is centralized, informatized, and intelligent, and the power distribution is improved. The safety, reliability and stability of the system have achieved the goal of unattended operation.
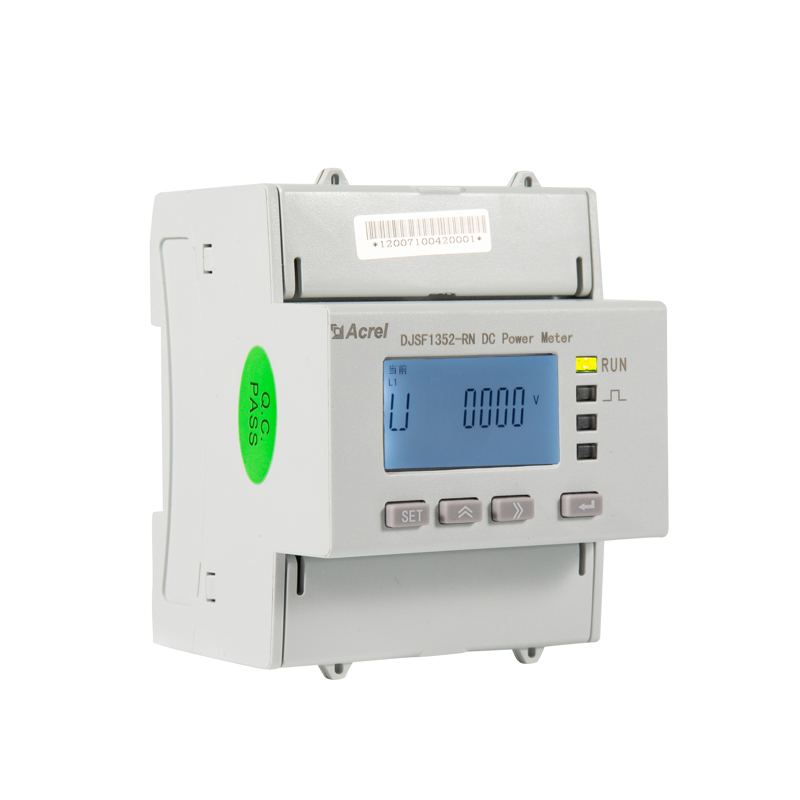
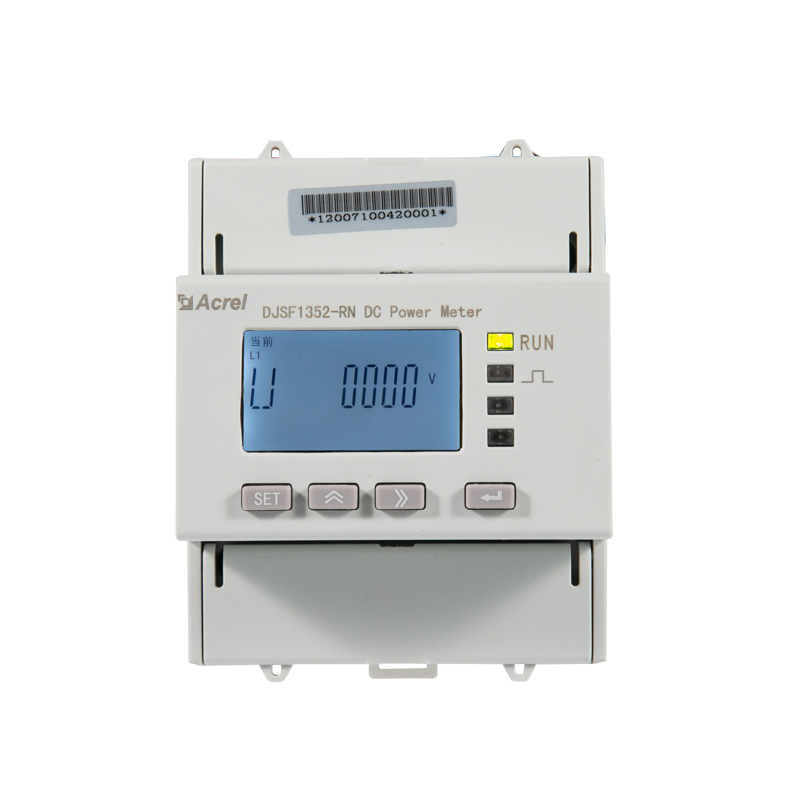
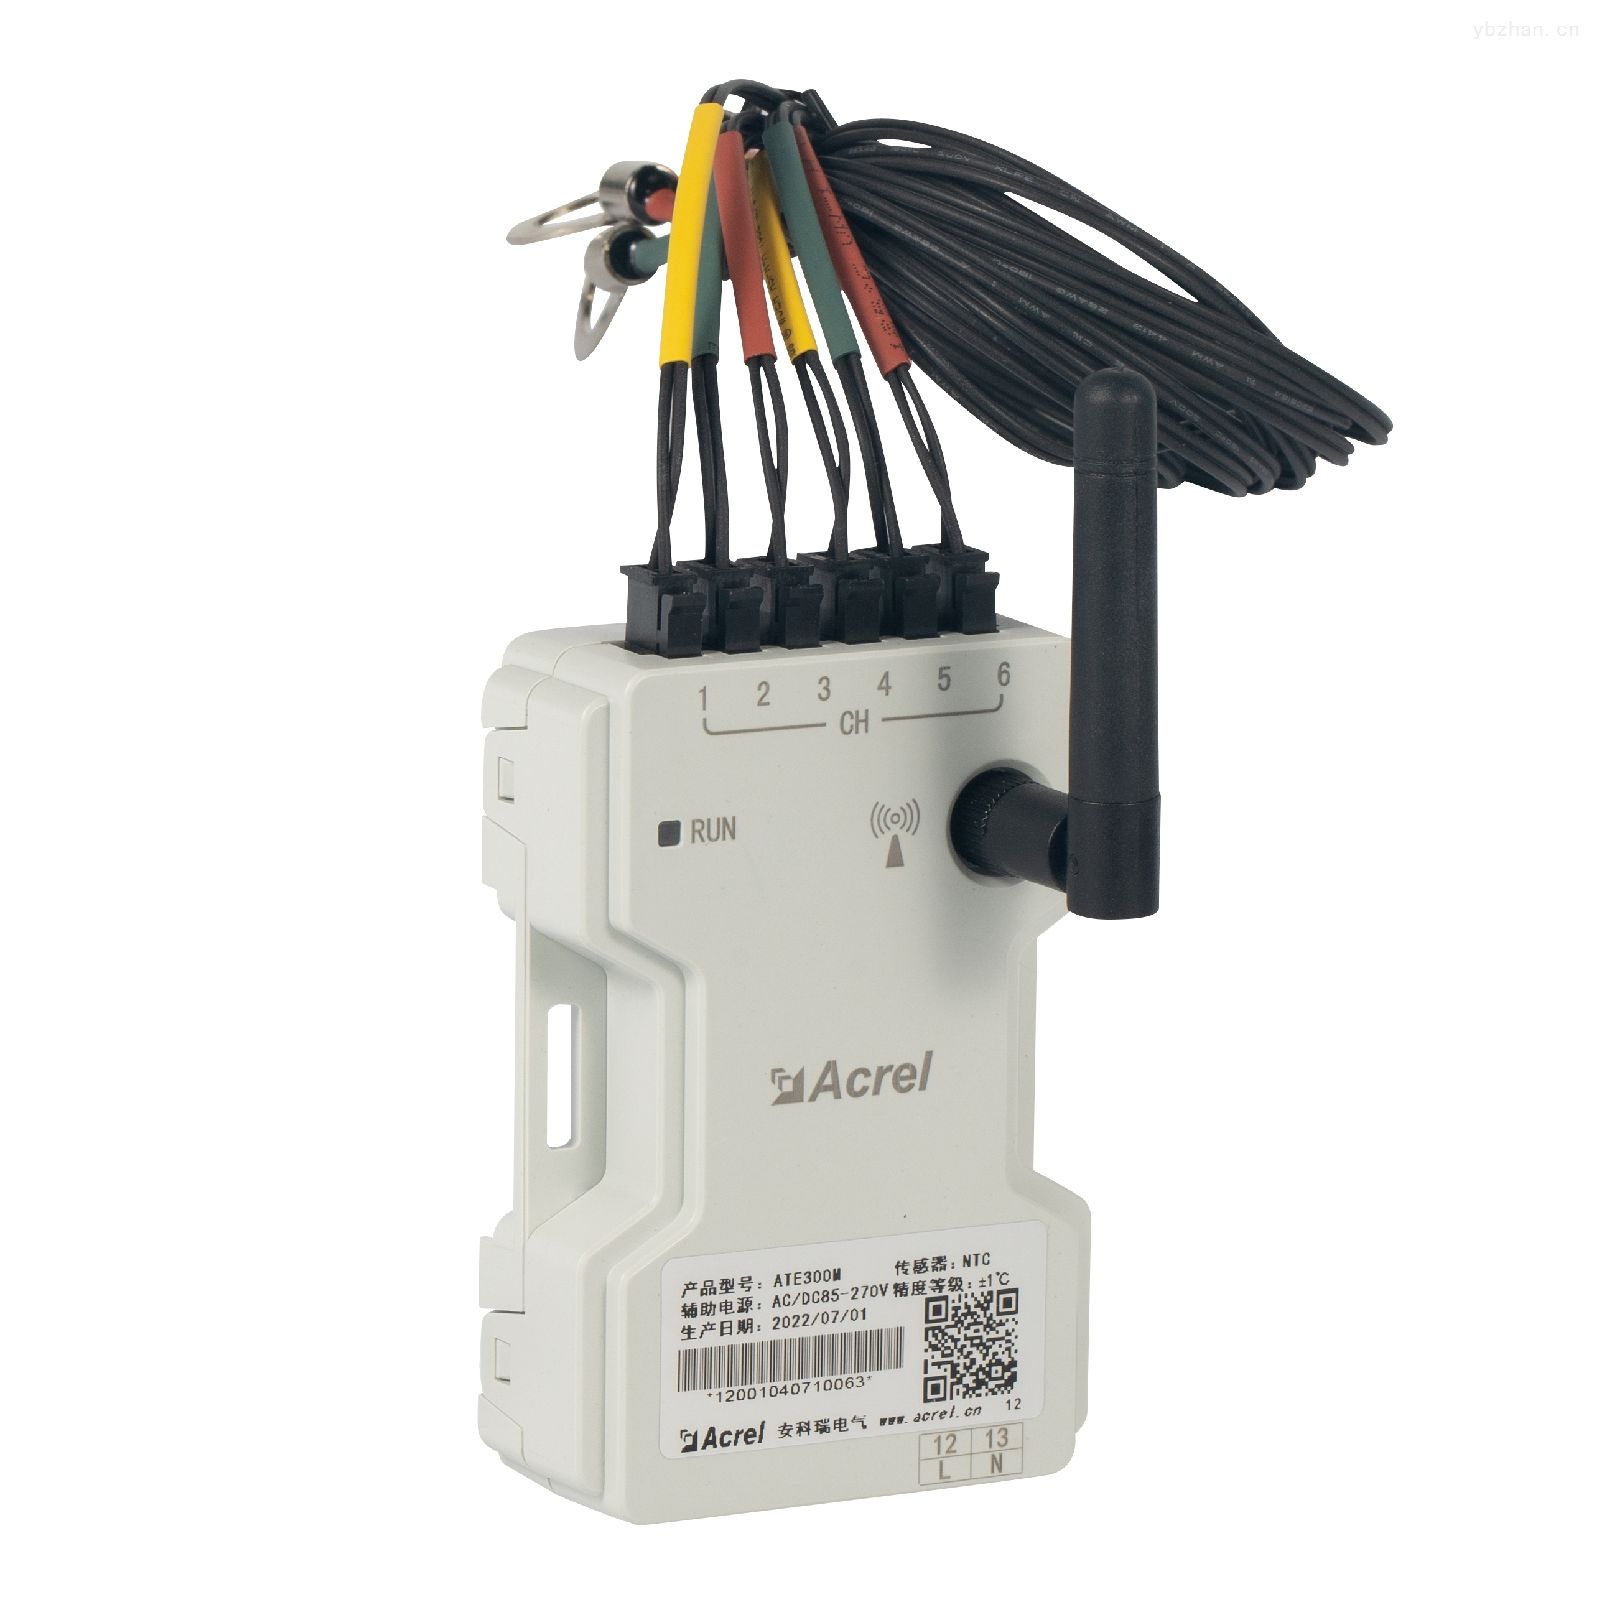
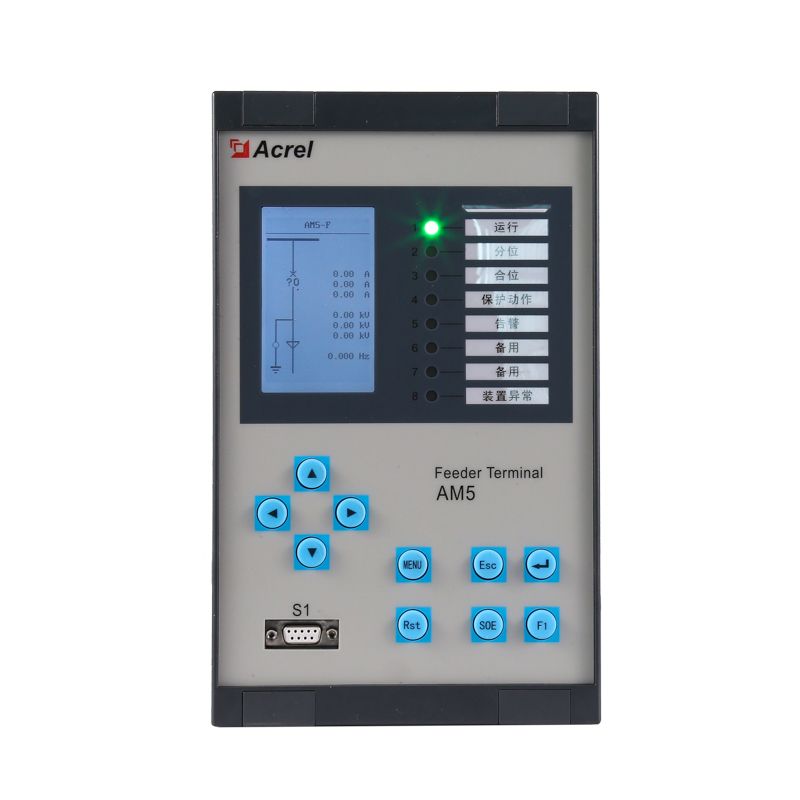
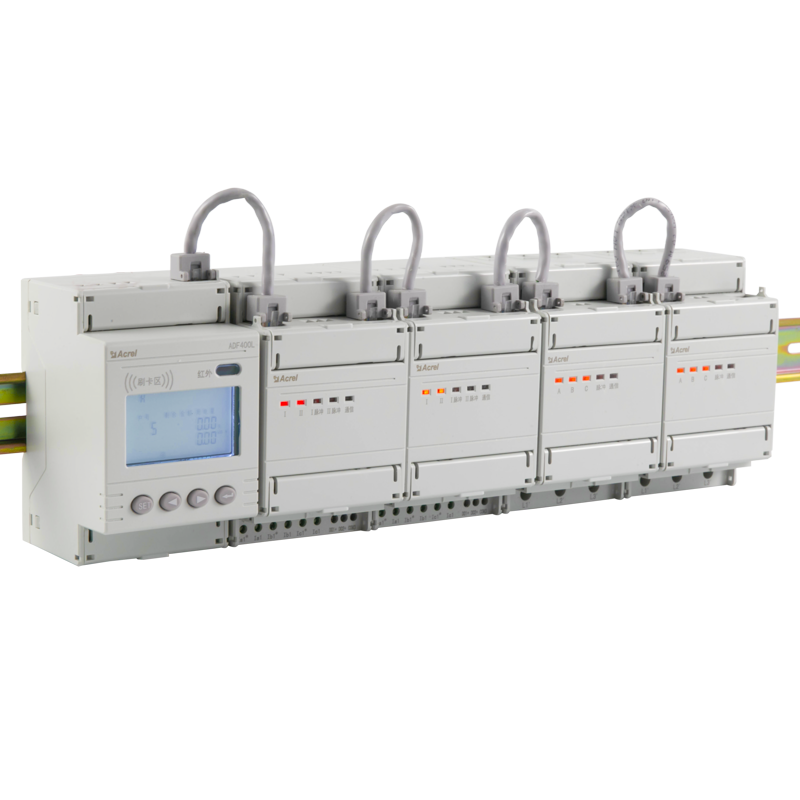
3)Field device layer
The field equipment layer is the data acquisition terminal, which is mainly composed of smart meters. The smart meters are connected to the communication server through the shielded twisted pair RS485 interface and the MODBUS communication protocol bus connection. The communication server reaches the monitoring host of the power distribution room for networking. Realize remote control.
System structure diagram3 System functions
The real-time monitoring system diagram of the substation is the main monitoring screen, which mainly monitors the operating status of all circuits in the substation in real time. Red represents closing and green represents opening. In the system diagram, you can intuitively see the operating parameters and status of each incoming and outgoing line, and you can see all the conventional power parameters on the outgoing side of the transformer, such as: three-phase voltage, current, active power, reactive power, and power factor , Frequency, active power, etc. As shown in the figure below:primary system diagram
The remote signaling and remote measurement alarm functions mainly complete the monitoring of the switch operation status of the low-voltage outlet circuits and the load incoming line. The pop-up alarm interface for switch displacement and load limit violations indicates the specific alarm location and sounds the alarm to remind the duty personnel to deal with it in time. The load limit can be set freely under the corresponding authority.
The event alarm record function mainly completes the record of the alarm information and the occurrence time of the alarm information that occurred during the query time period, and provides the basis for the staff on duty and analyzes the cause of the accident, as shown in the following figure:
Alarm function real-time queryParameter meter reading function, mainly to query the electrical parameters of the low-voltage outgoing circuit. Supports electrical parameter query at any time, with functions such as data export and report printing. This report queries the electrical parameters of the low-voltage circuits of the incoming and outgoing lines of the Adama power distribution room, mainly including: three-phase current, active power and active power. The name of each circuit in this report is associated with the database, which is convenient for users to modify the name of the circuit. As shown below:
Parameter meter reading
The power consumption report function can select the time period for query, supports the cumulative query of the power consumption at any time period, and has the functions of data export and report printing. Provide accurate and reliable electric energy report for the staff on duty. The name of each circuit in this report is associated with the database, which is convenient for users to modify the name of the circuit. As shown in the figure below, the user can print the report directly, and save it to another location in EXCEL format. As shown below:Energy report
A schematic diagram of the system communication structure, which mainly shows the network structure of the system. The system adopts a hierarchical distributed structure and monitors the communication status of the bay layer equipment at the same time. Red indicates that the communication is normal, and green indicates that the communication is faulty. The figure below is a schematic diagram of the communication status of the substation.Communication structure diagram
4 Conclusion
In the application of today’s power distribution facilities, the safety of the project’s power distribution is very important. The application of the Acrel-2000 power monitoring system in the Adama described in this article can realize the real-time power consumption of the power supply and distribution circuit in the power distribution room. Monitoring, not only can display the power status of the loop, but also has a network communication function, which can form a power monitoring system with a serial server, a computer, etc. The system realizes the analysis and processing of the collected data, real-time display of the operation status of the distribution circuits in the distribution room, pop-up alarm dialogs, voice prompts for load exceeding limit, and generates various electric energy reports, analysis curves, graphics, etc., which is convenient The remote meter reading, analysis and research of electric energy show that the system is safe, reliable and stable, providing a true and reliable basis for the project to solve the electricity problem, and has achieved good benefits.
Bibliography
1.Solutions For Enterprise Micro-grid System 2020.02
新发布 -
-
 安科瑞电气股份有限公司13611965514内容声明:谷瀑为第三方平台及互联网信息服务提供者,谷瀑(含网站、客户端等)所展示的商品/服务的标题、价格、详情等信息内容系由店铺经营者发布,其真实性、准确性和合法性均由店铺经营者负责。谷瀑提醒您购买商品/服务前注意谨慎核实,如您对商品/服务的标题、价格、详情等任何信息有任何疑问的,请在购买前通过谷瀑与店铺经营者沟通确认;谷瀑上存在海量店铺,如您发现店铺内有任何违法/侵权信息,请在谷瀑首页底栏投诉通道进行投诉。安科瑞电气股份有限公司 电话:021-69153629 手机:13611965514 地址: 上海市嘉定区育绿路253号